IMERSS Biodiversity Visualisations Portal
The Institute for Multidisciplinary Ecological Research in the Salish Sea (IMERSS)
is building a federated collection of datasets on biodiversity for localities in the area, together with
matching configurations of our web-based visualisation software. This portal collects links to the data and
these visualisations as hosted in GitHub pages and elsewhere. Taken as a whole,
this collection highlights the flexibility of the visualisation framework and its ease of adaptation to
map-based or non map-based data, with the ability to weave content from artists, designers, developers and local communities
into the presentation.
Scrollytelling visualisations
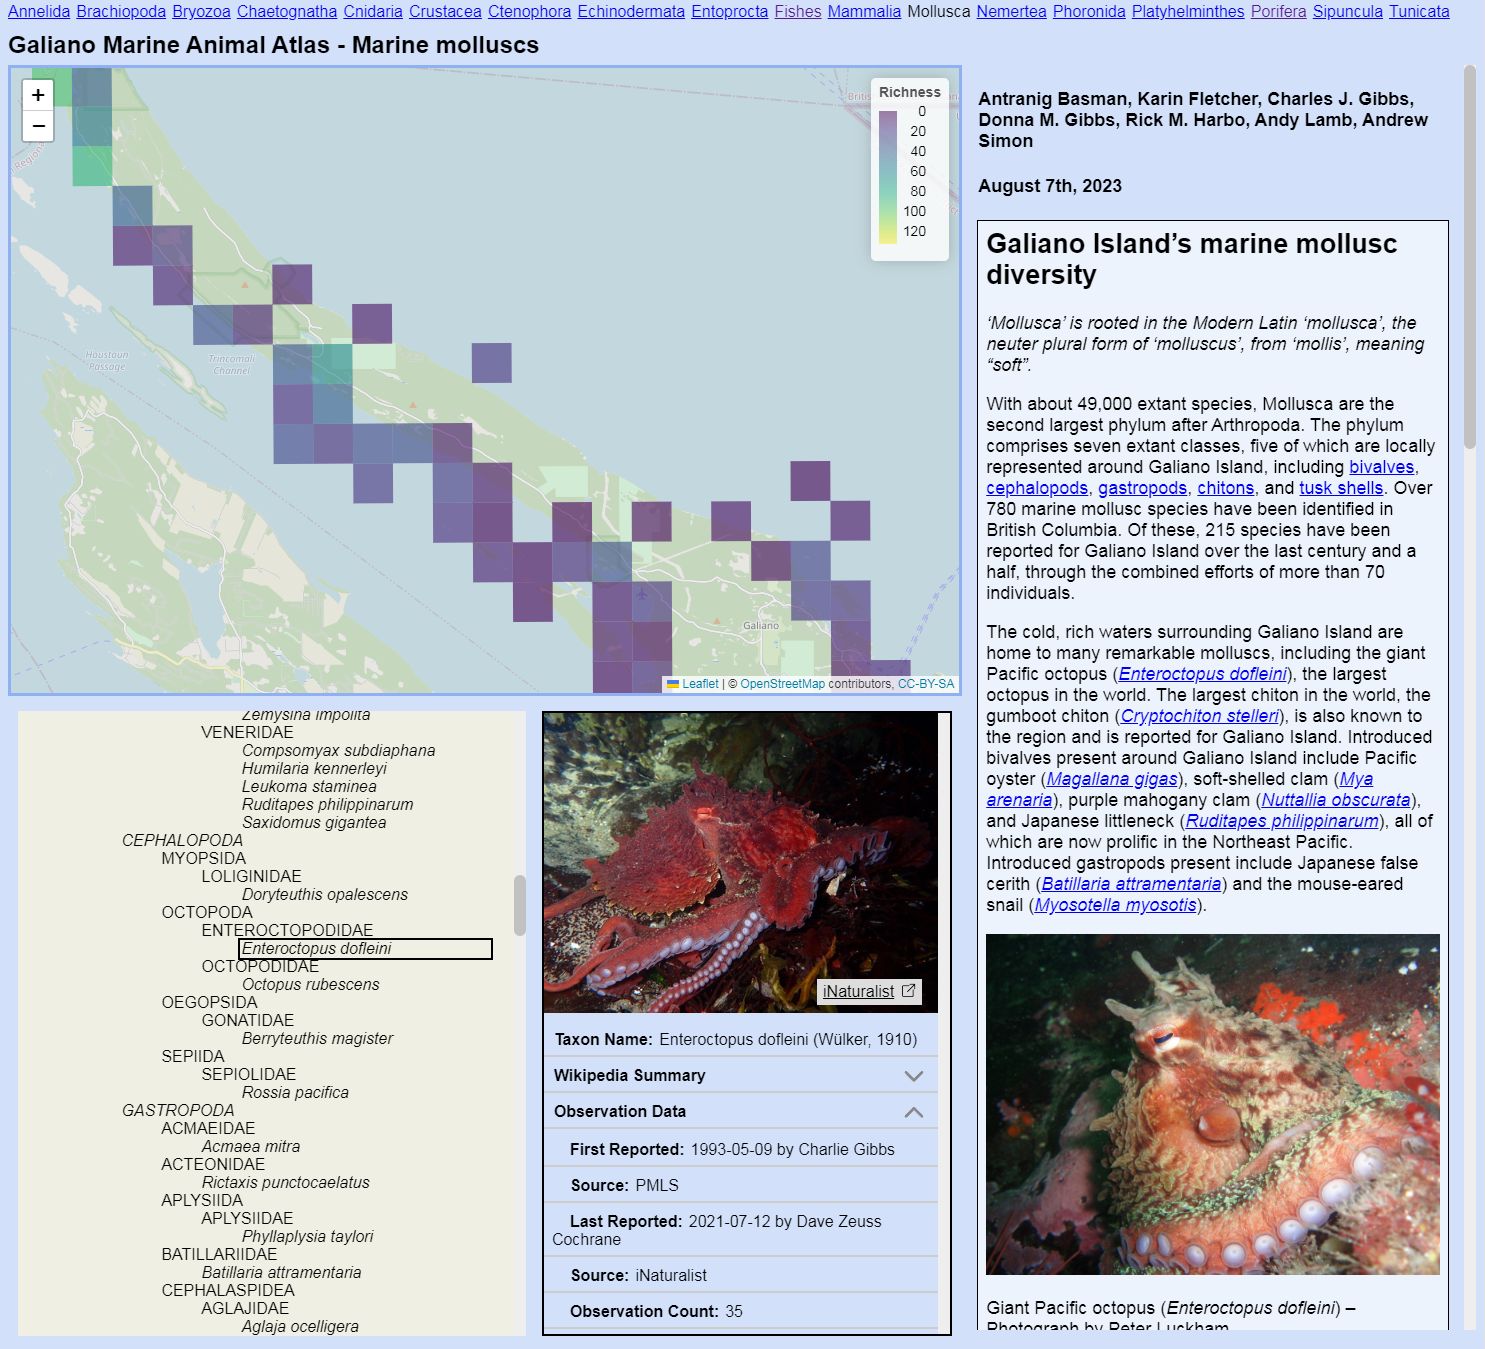
Galiano Marine Atlas
The Galiano Marine Atlas
presents the marine animals of Galiano Island broken down into 18 major phyla. Each group, for example
Annelids,
Molluscs,
Tunicates, etc. are framed in a scrollytelling narrative foregrounding their taxonomic interest,
notable observations in the area and community contributions to their understanding. A vignette also contrasts the
coverage of historical, scholarly observations with more recent efforts derived from citizen science.
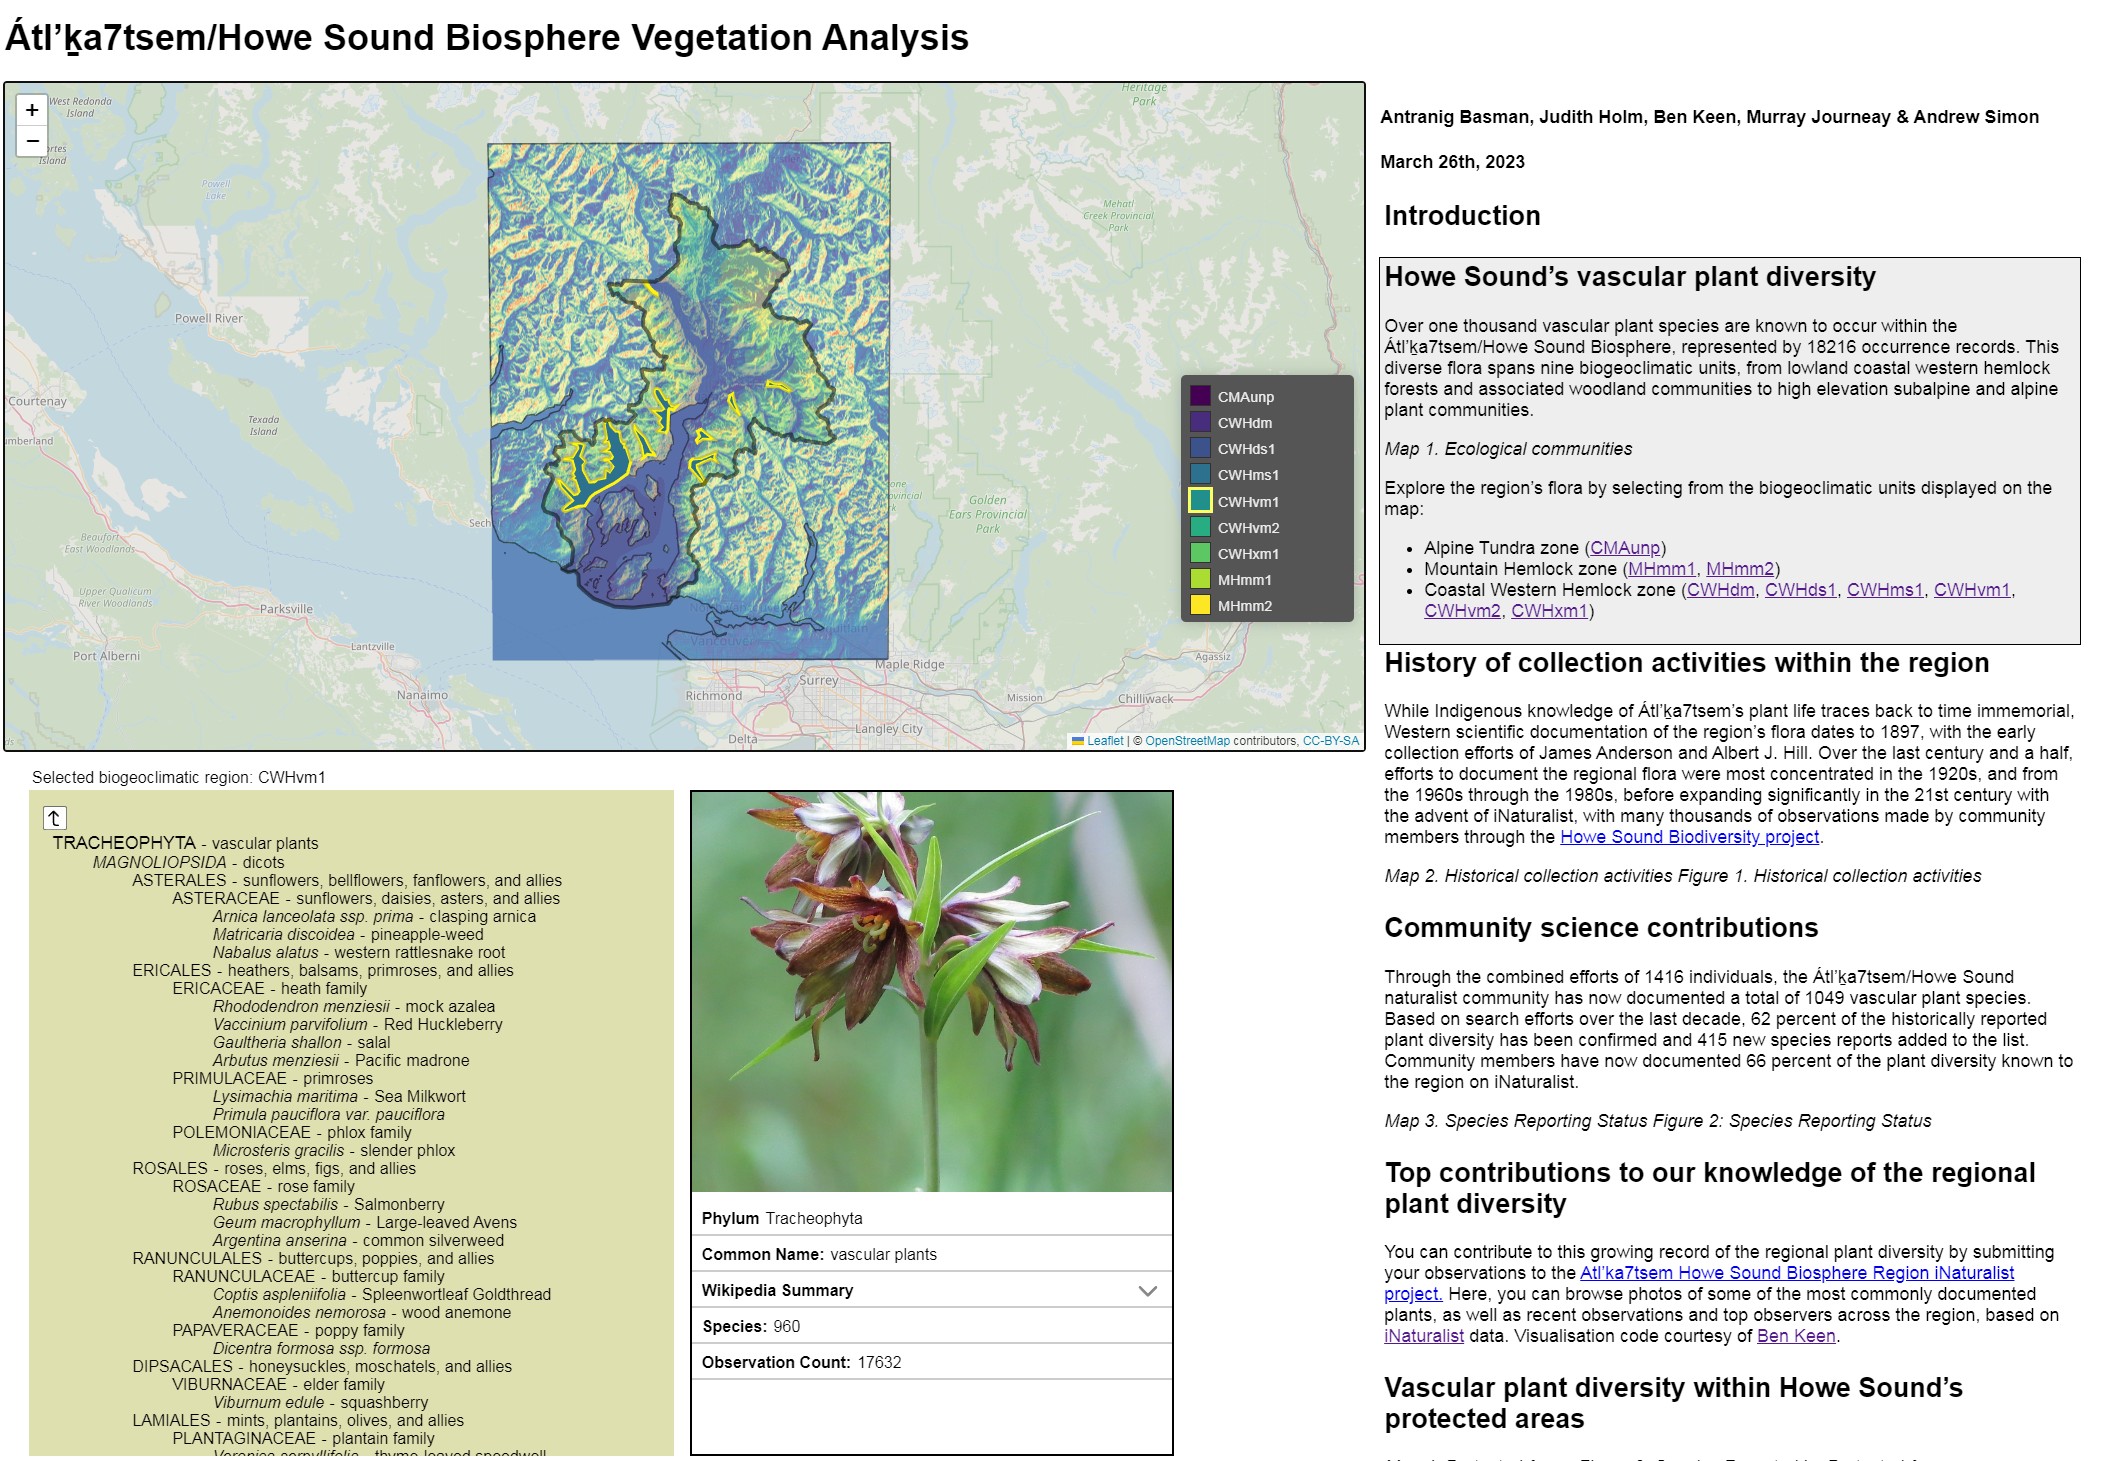
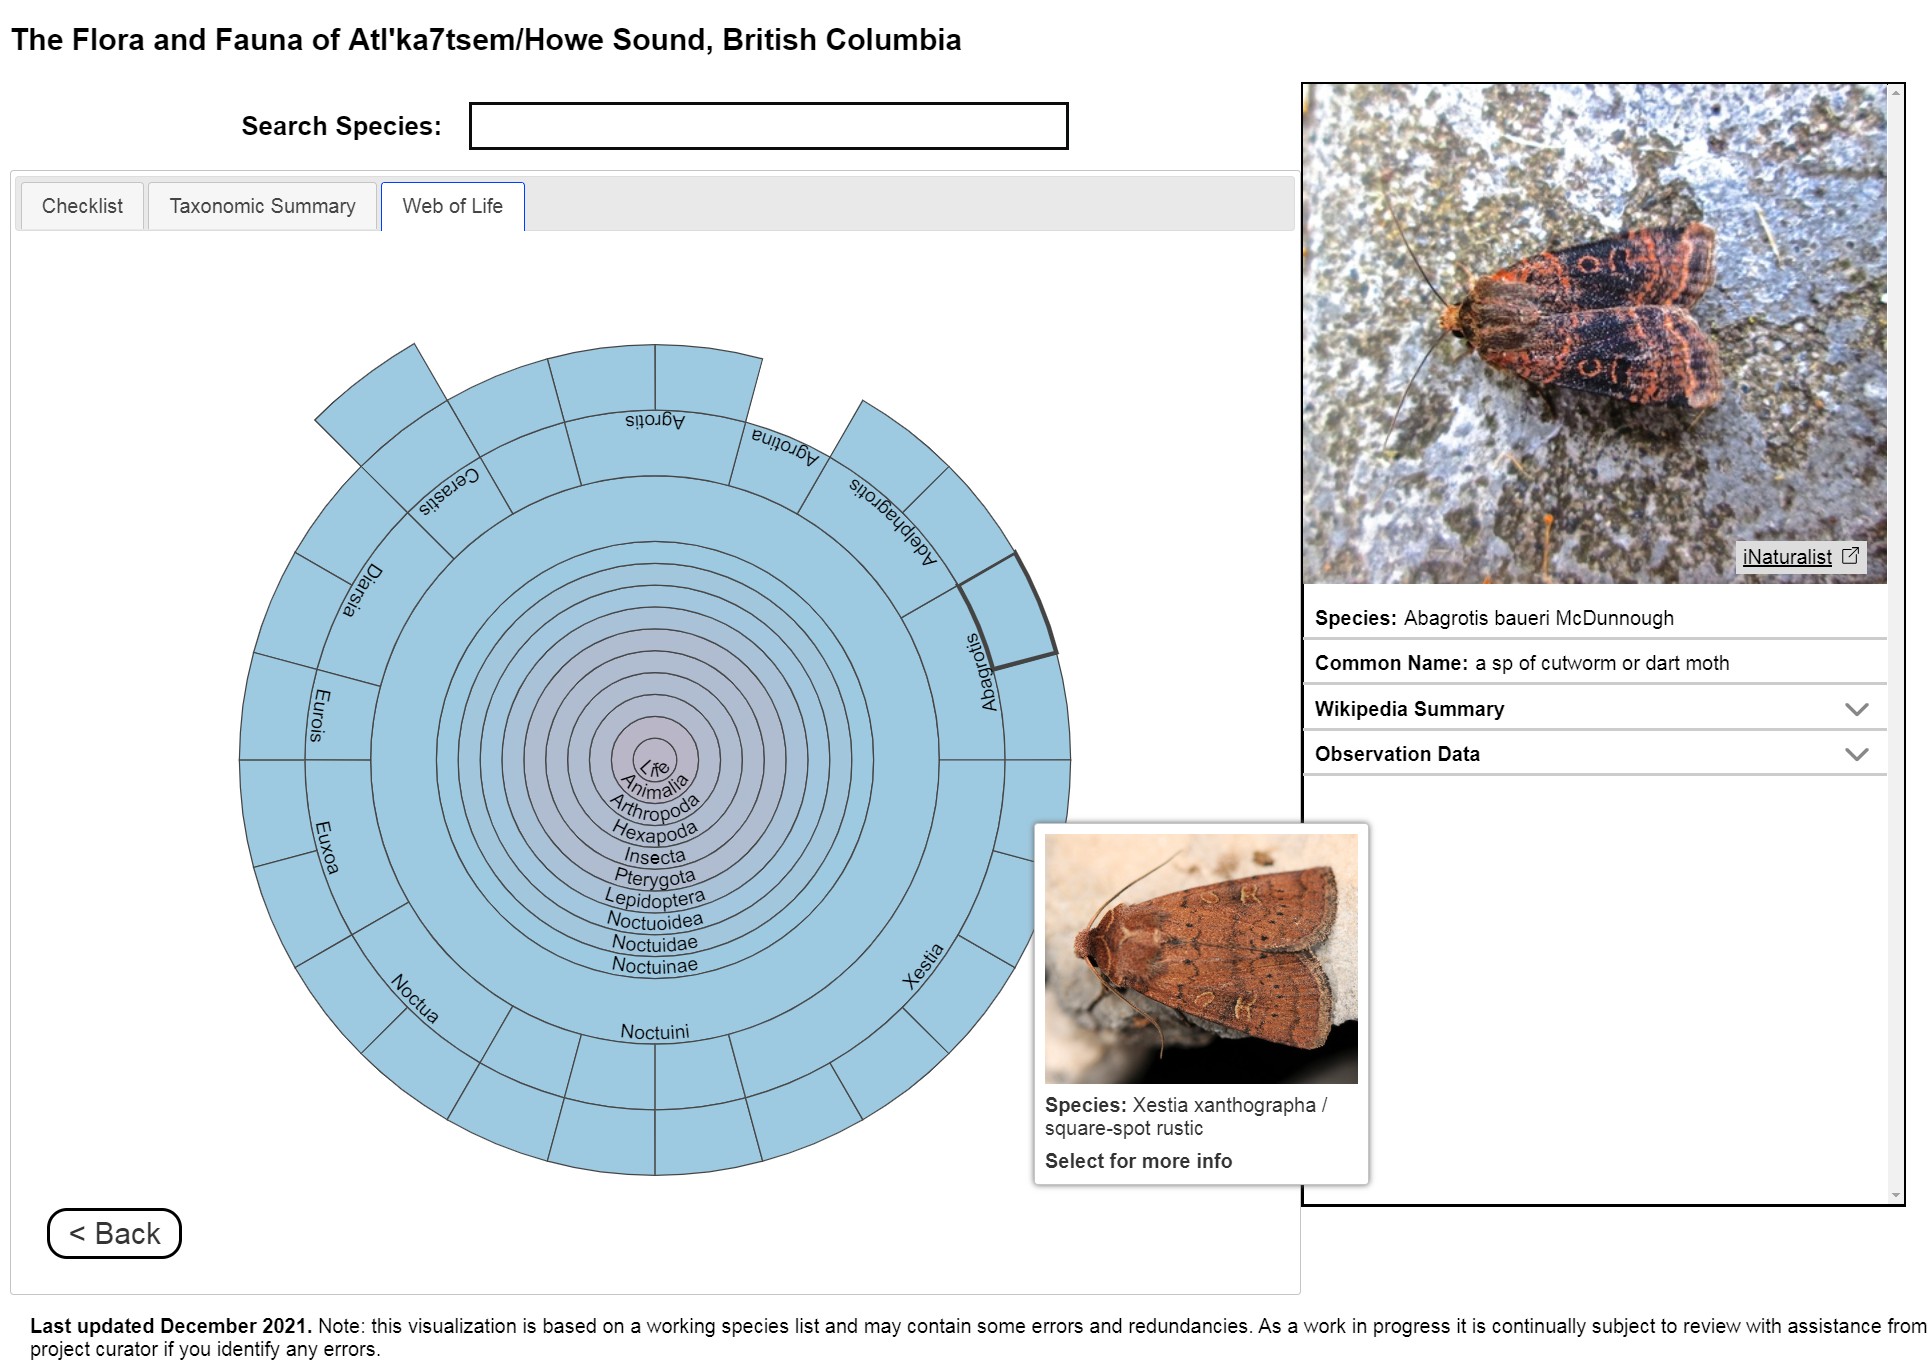
Átl’ḵa7tsem/Howe Sound Biosphere Vegetation Analysis
A short distance from Vancouver, the Átl’ḵa7tsem/Howe Sound Biosphere Reserve
encompasses the fjord and islands of Átl’ka7tsem/Howe Sound over a 218,723 ha area.
Átl’ka7tsem (pronounced At-Kat-sum) is the Sḵwx̱wú7mesh/Squamish word for "paddling up the Sound".
IMERSS is developing a biodiversity assessment framework for the region (e.g., a
prototype scrollytelling visualisation
of the region's vascular plant diversity). This evolving framework integrates several components of our
biodiversity data science infrastructure, including the scrollytelling and
core biodiversity framework, as well as iNaturalist observations widgets developed by
Howe Sound resident Ben Keen.
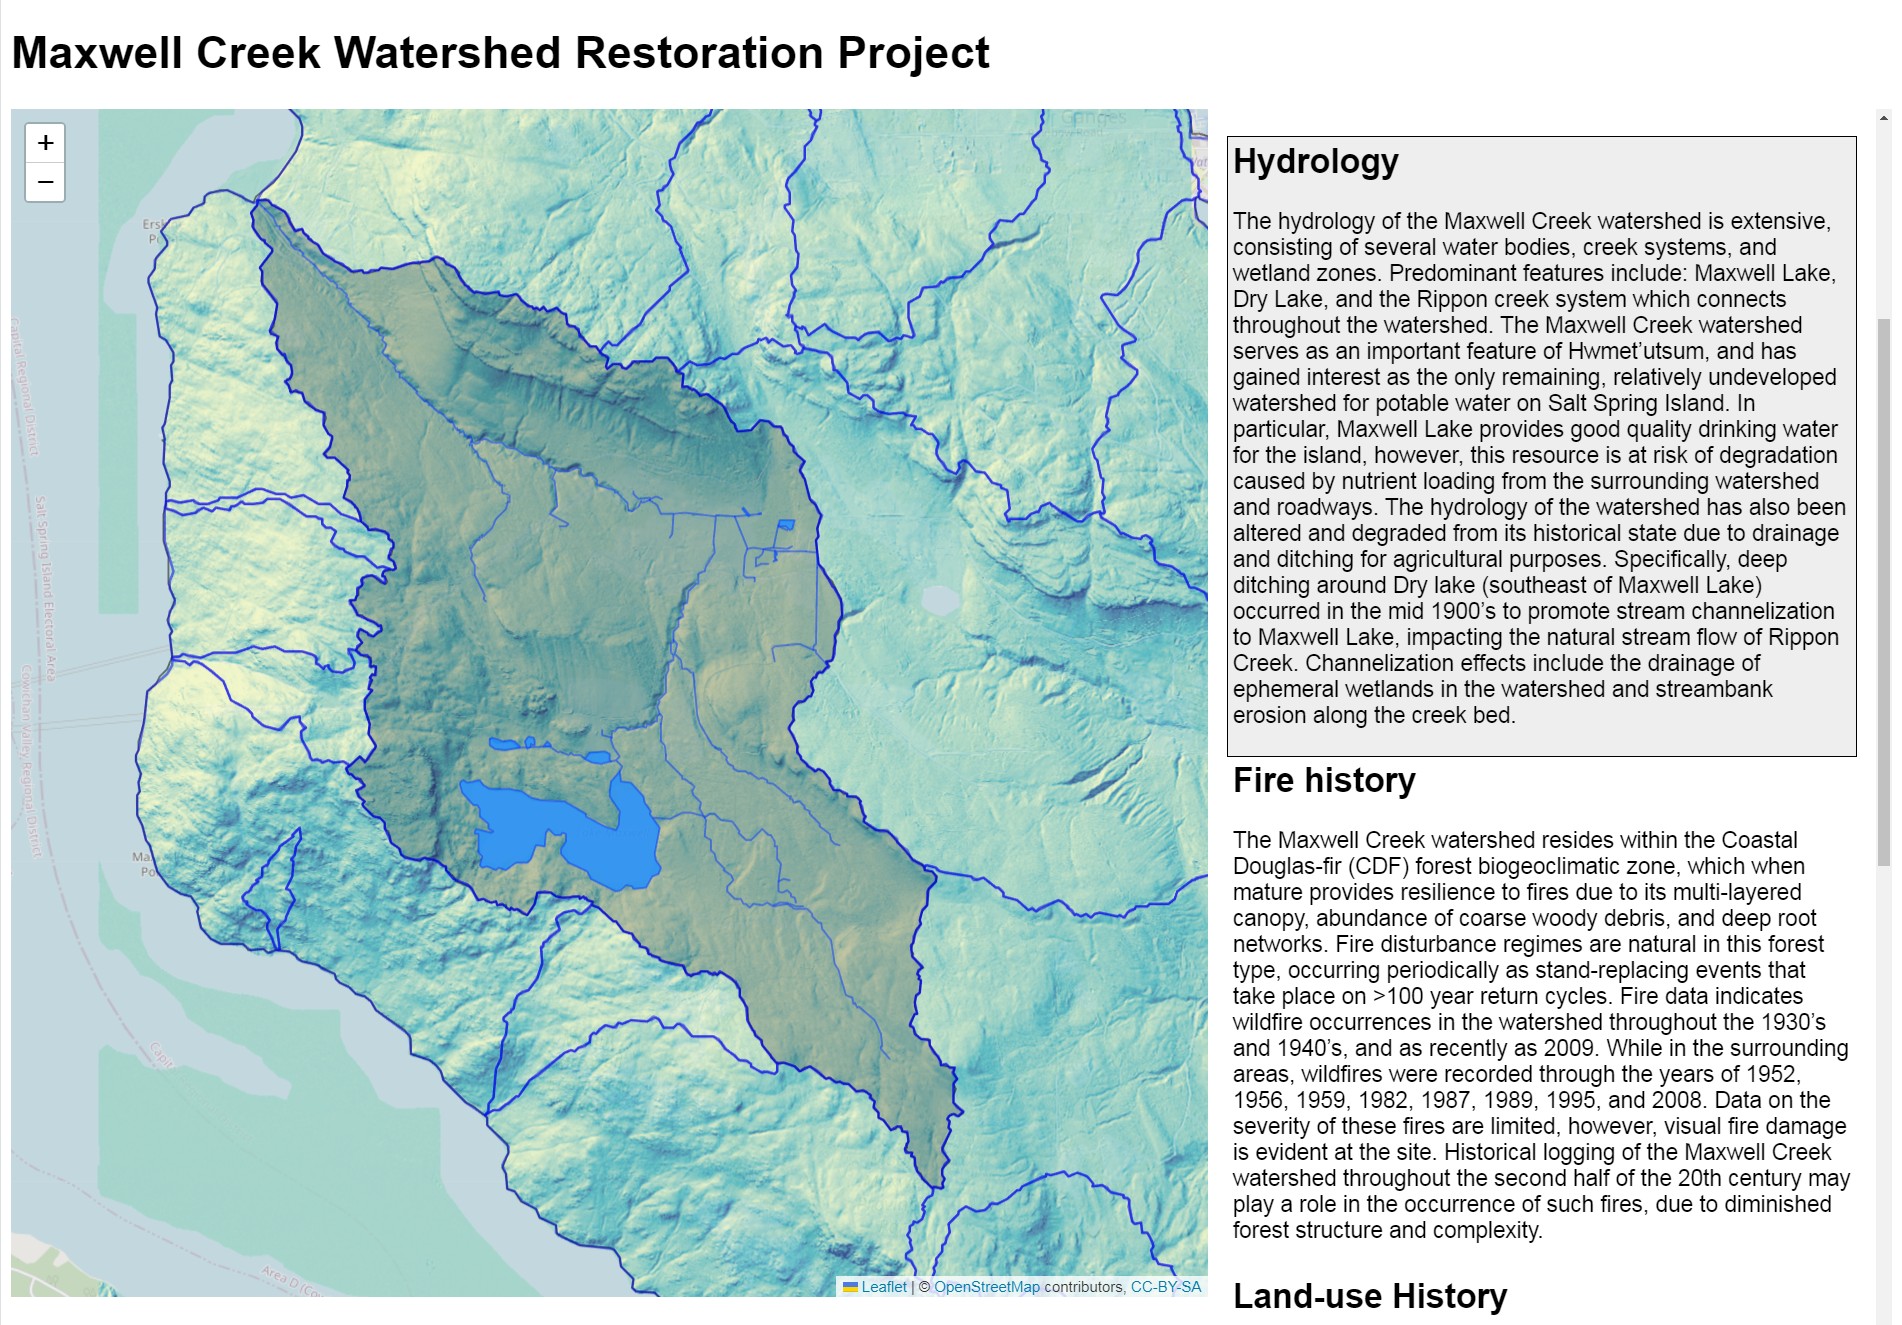
Maxwell Creek watershed project
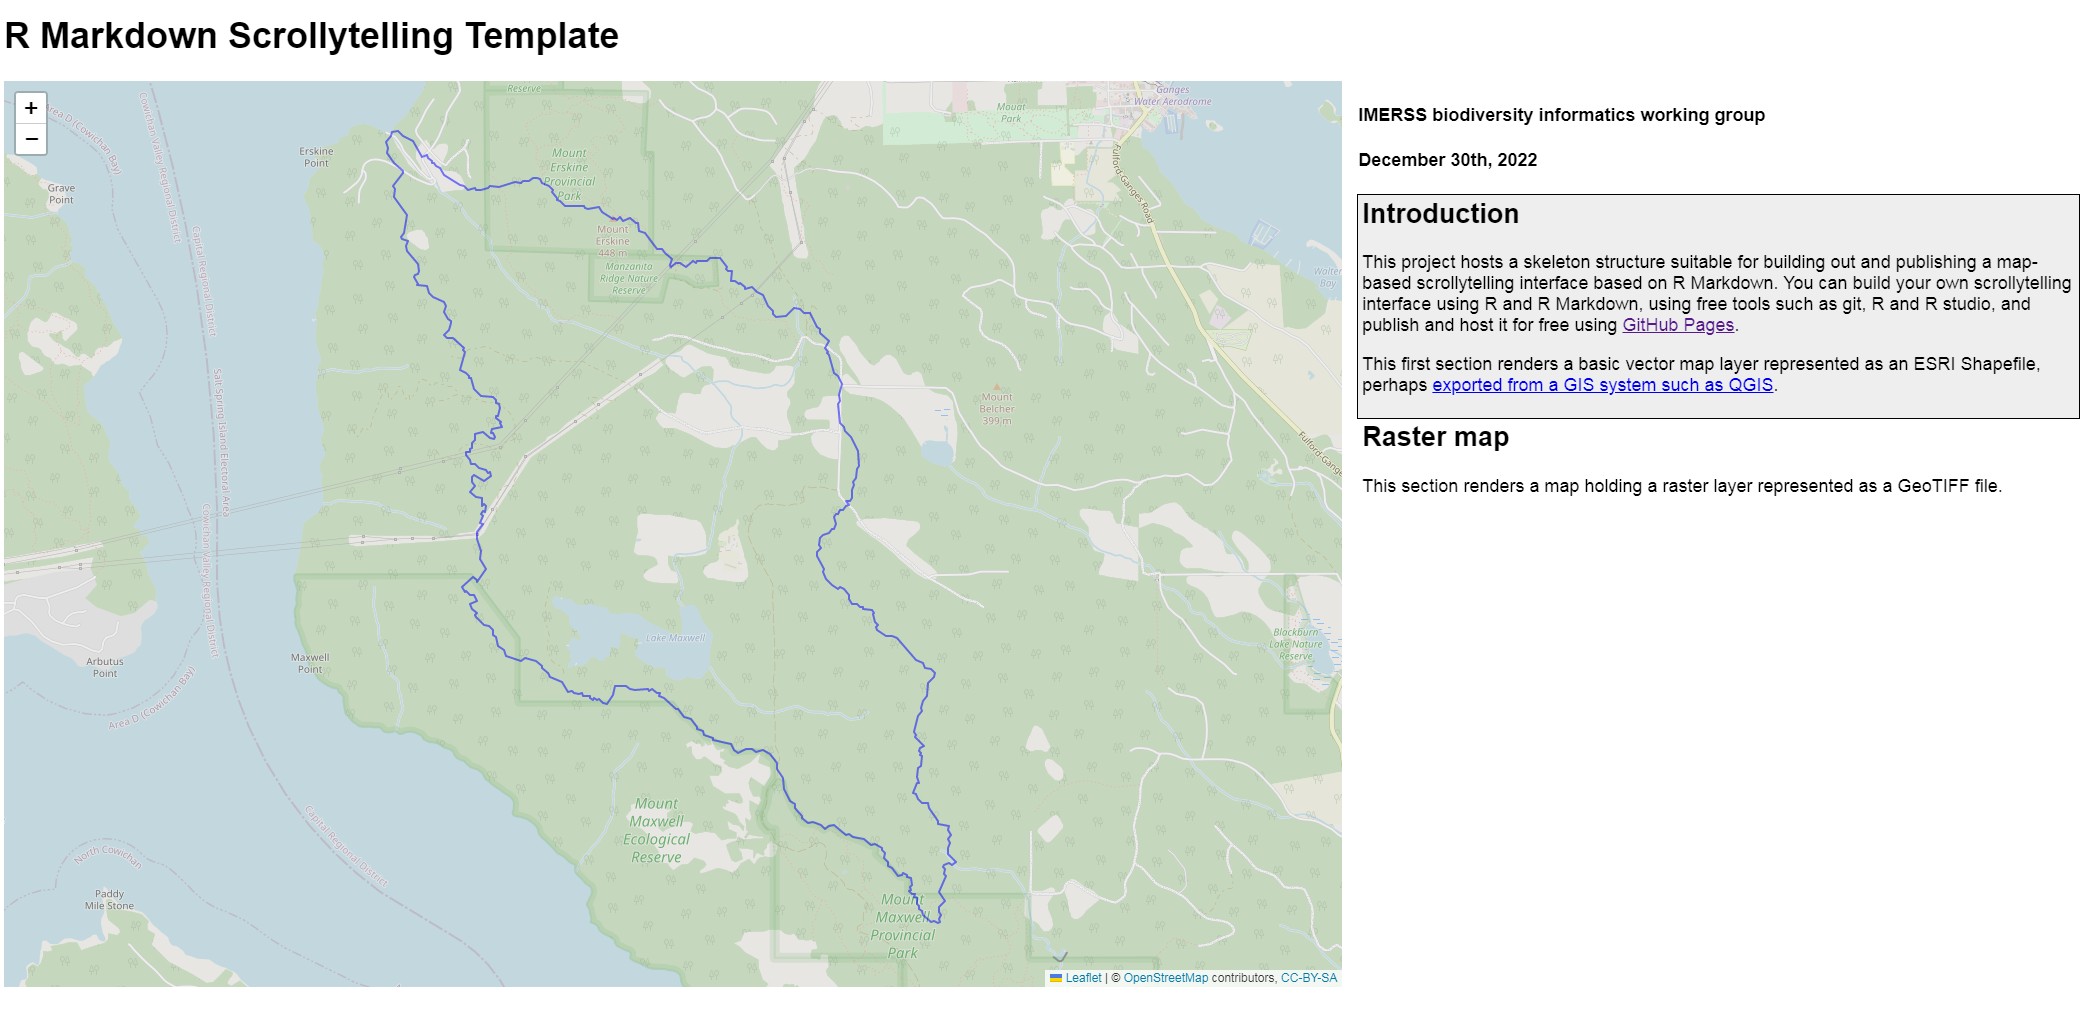
Development of the R Markdown Scrollytelling framework began with the
Maxwell Creek Watershed Project
project undertaken with Transition Salt Spring.
The ultimate goal of the Project is to better understand and define the
efficacy of nature-based solutions for forest and hydrological restoration, towards enhanced
ecological integrity and biodiversity in the Maxwell Creek watershed.
This scrollytelling presentation
of the project is a work in progress, available in GitHub pages.
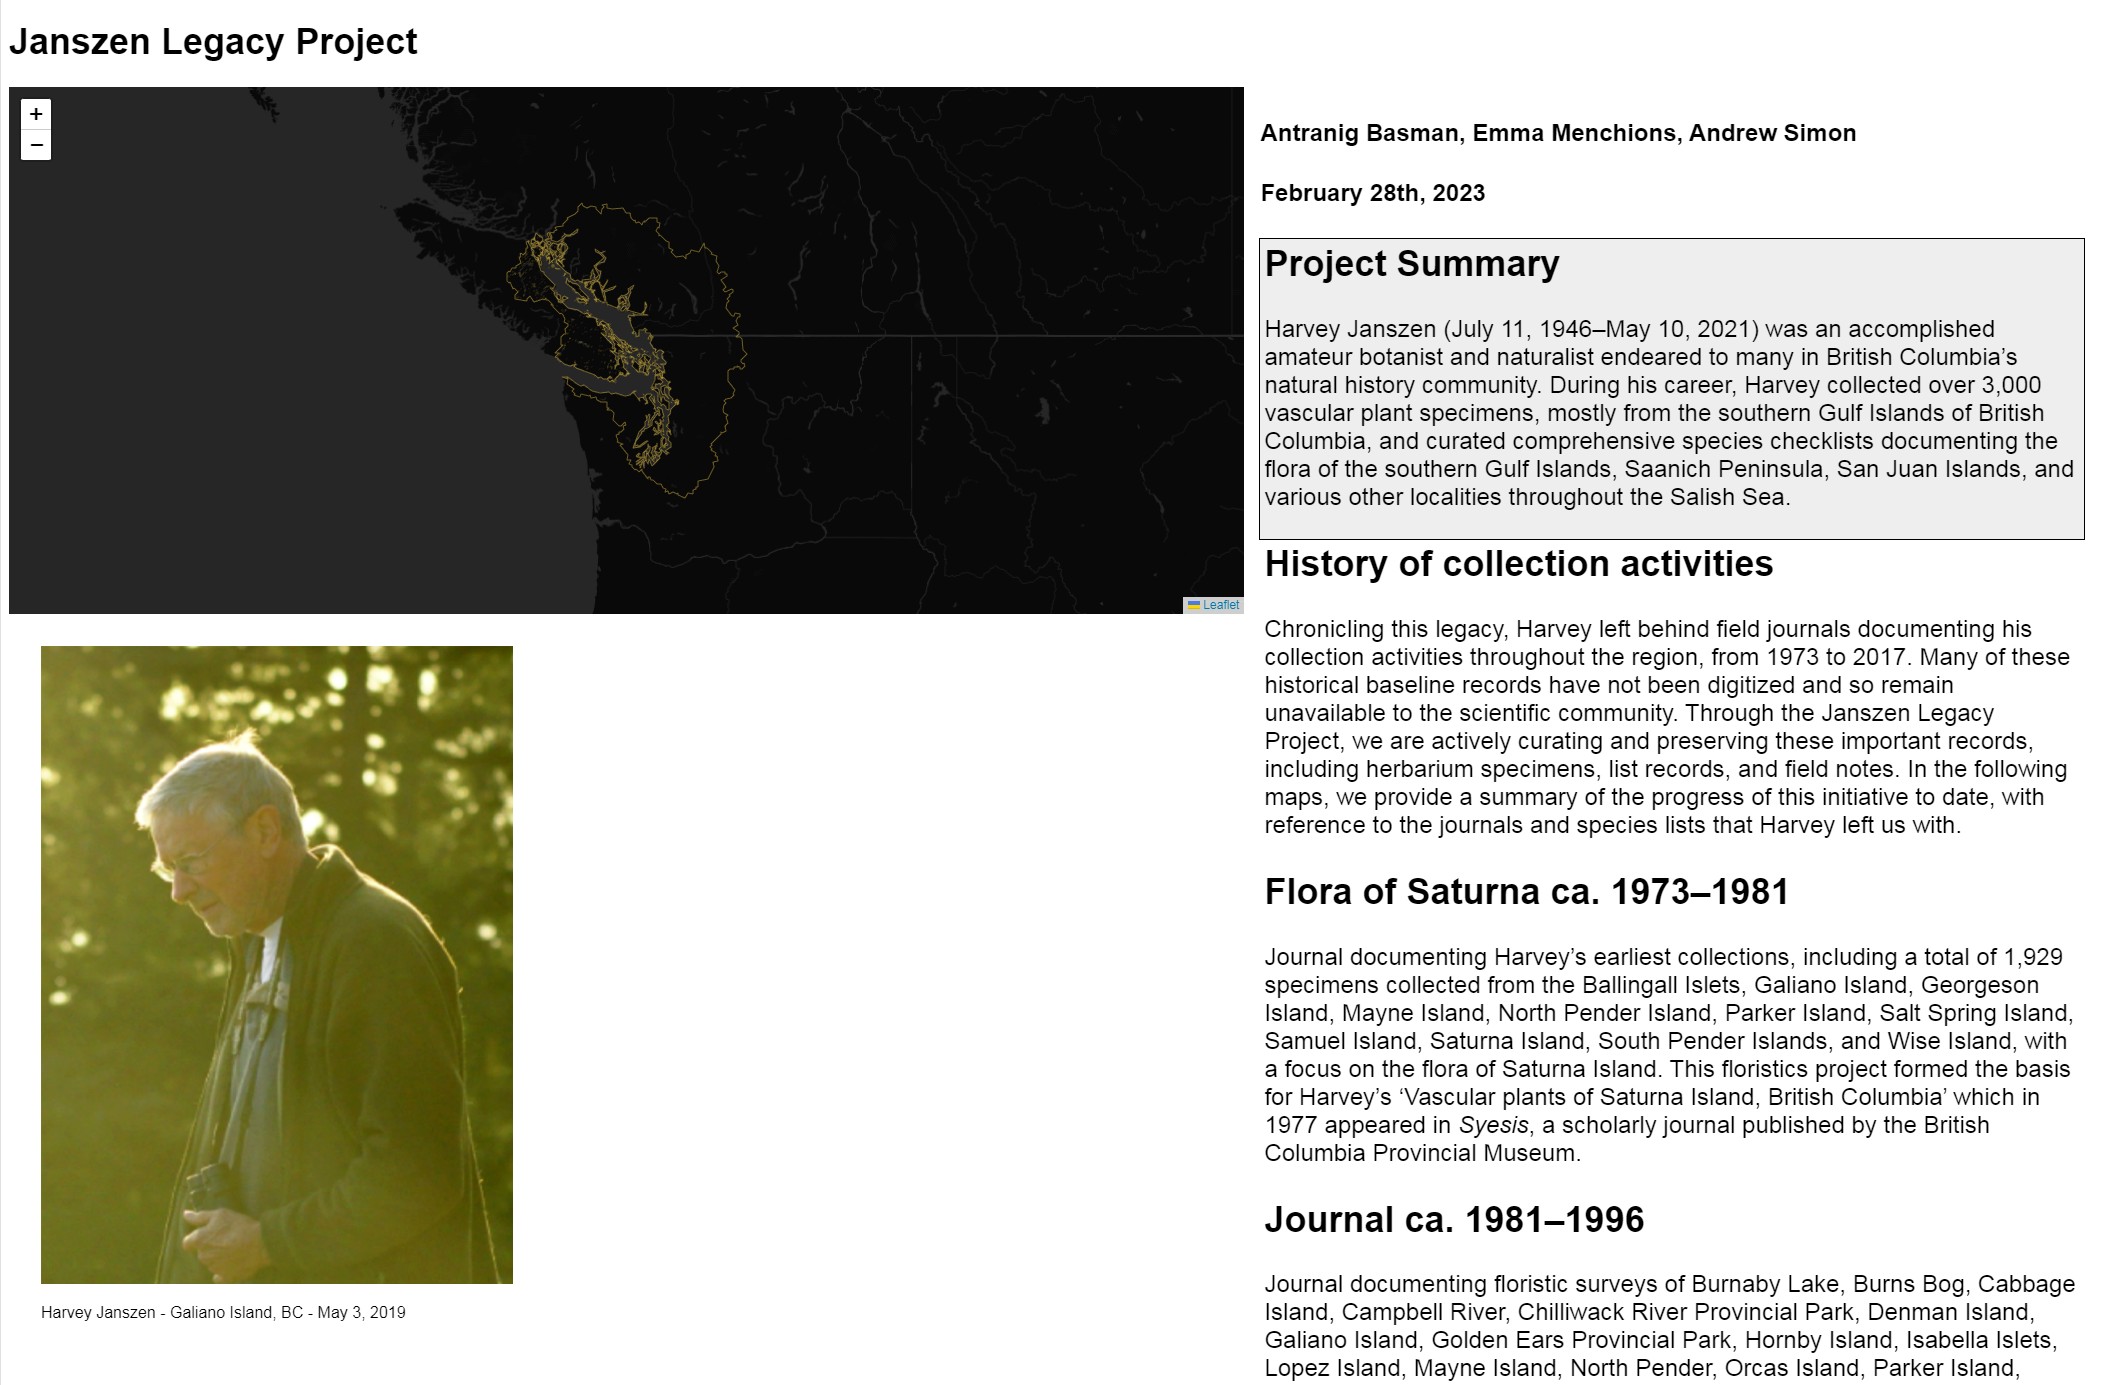
Janszen Legacy Project
Harvey Janszen (July 11, 1946–May 10, 2021) was an accomplished amateur botanist and naturalist endeared to many in British Columbia's
natural history community. During his career, Harvey collected over 3,000 vascular plant specimens,
mostly from the southern Gulf Islands of British Columbia, and curated comprehensive species checklists
documenting the flora of the southern Gulf Islands, Saanich Peninsula, San Juan Islands, and various other
localities throughout the Salish Sea.
This scrollytelling storymap
presents a summary of the progress being made to preserve Harvey's work, with support from the Canadian Institute for
Ecology and Evolution.
The above scrollytelling visualisations were built from on this common framework which is available for other
communities to adapt. The R Markdown Scrollytelling Template
empowers naturalists with moderate technical skills to edit documents in simply structured
R Markdown format, the web output of which is then rewoven into an
interactive scrollytelling interface hosted in
GitHub pages.
The template can be adopted by forking its GitHub project and customising it to your ends.
Visualisations using core biodiversity framework
Despite their diversity, all of the visualisations in this section use a common codebase, presenting either checklists or catalogues
of biodiversity observations in various forms, including hierarchical text-based summaries, circular "starburst"
visualisations, optional maps and controls for filtering based on datasets.
All data underlying and code implementing these visualisations is hosted in the
IMERSS Bioinformatics Working Group repository on GitHub.
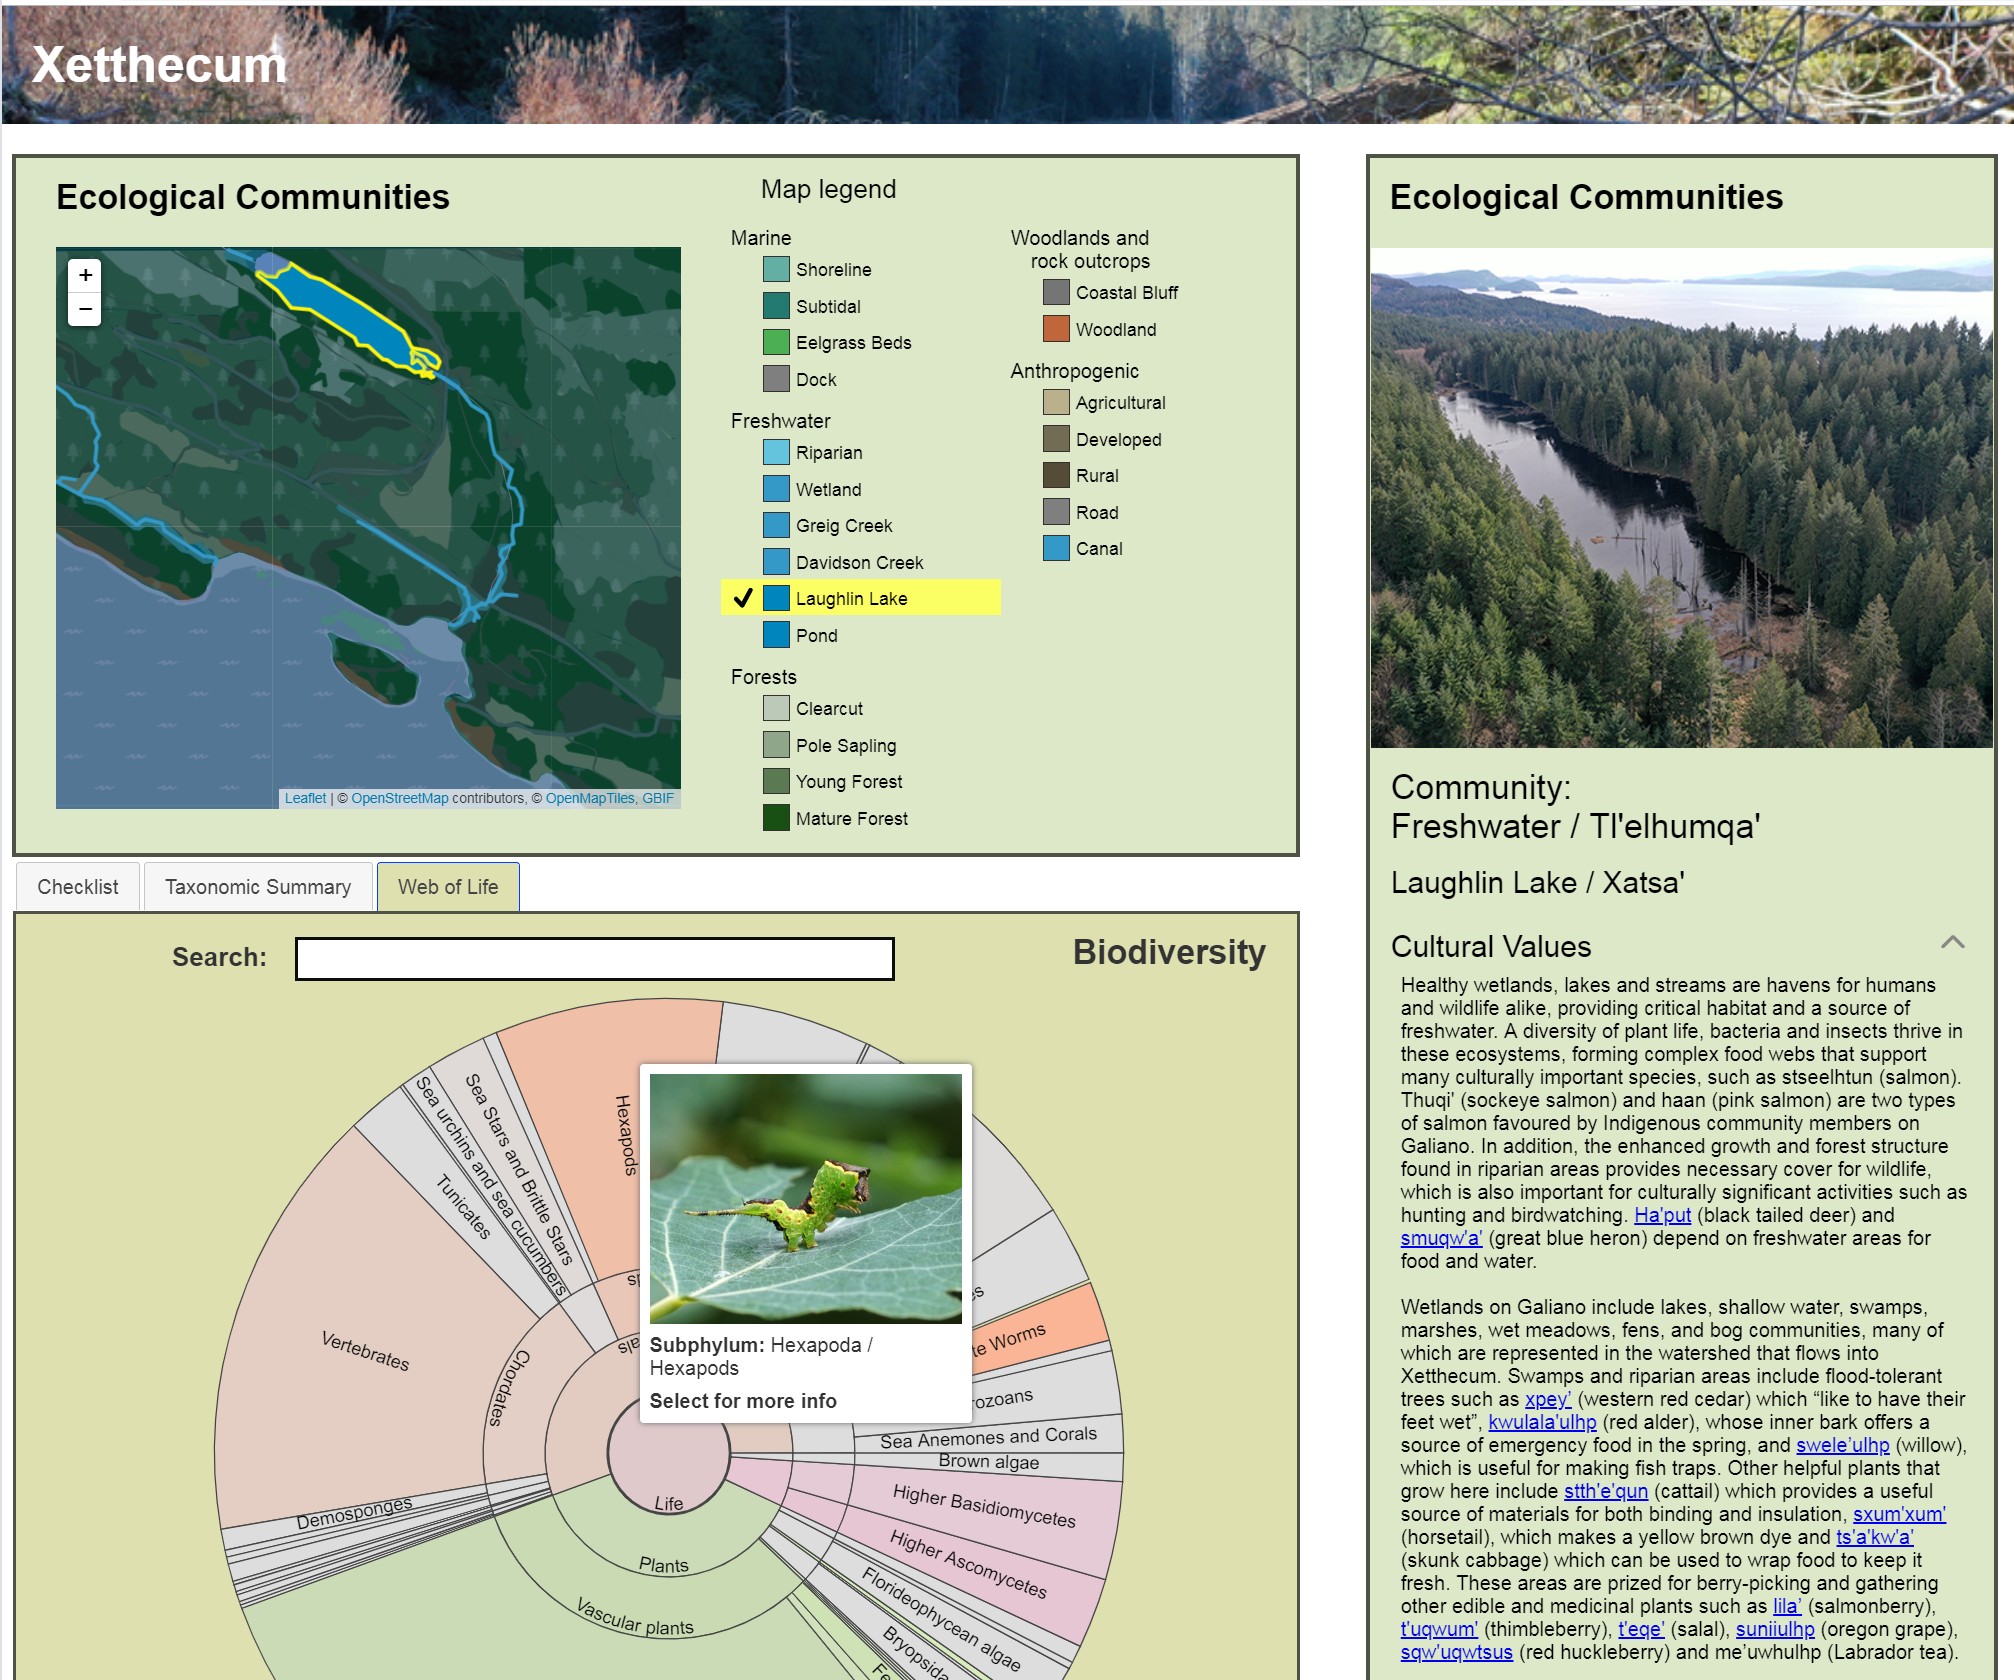
Xetthecum
Our most developed visualisation, an ecocultural mapping pilot
being led by Jeannine Georgeson and Andrew Simon (IMERSS) on behalf of Whiteswan Environmental.
Xetthecum is a culturally significant site on the
coast of Galiano Island, also known as Retreat Cove.
The project incorporates data shared by Indigenous and non-Indigenous community members, local biodiversity data,
written and spoken Hul'qumi'num names, and geospatial data describing ecological communities.
A YouTube video presented by Dana Ayotte has been published at Ecocultural
Mapping Tool and was presented at the April 2022
Indigeverse conference.
Processed observational data are available at
reintegrated-obs.csv and the
provenance.txt.
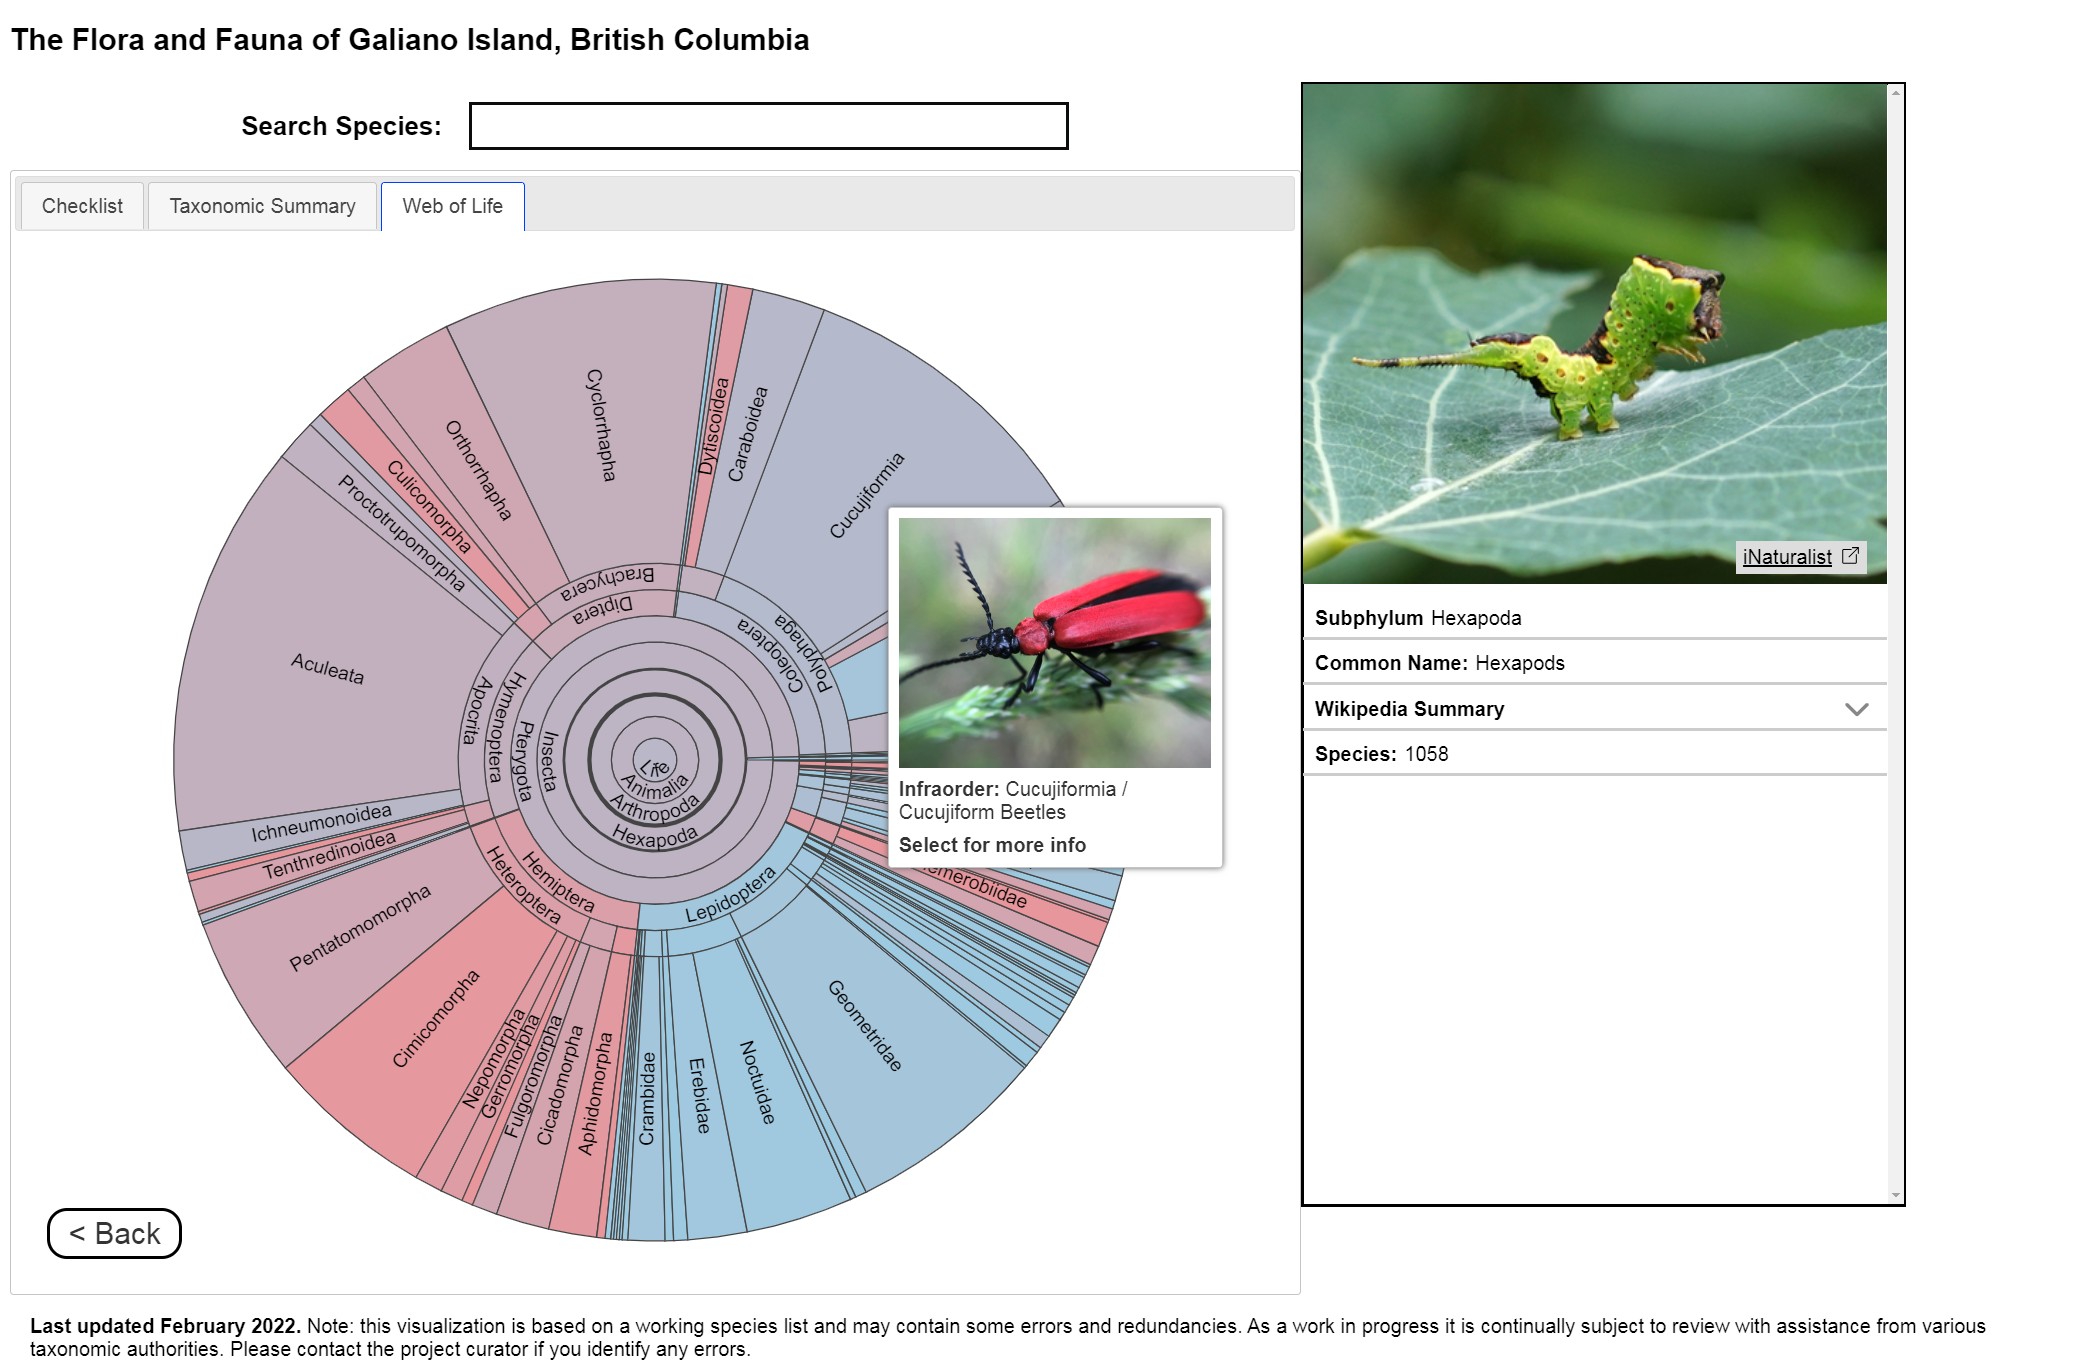
Galiano Life List
The Galiano Life List presents a basic visualisation of a species checklist without
georeferencing data, showing the checklist and sunburst tabs with a taxon information panel. This visualisation may be
seen hosted in various configurations with slightly different styling on the
Biodiversity Galiano web site (currently implemented in WordPress)
on pages such as Life List,
Spiders and
Butterflies and Moths.
A variant configuration, using miniature "phylopics" from artist Kath Boake Wüthrich to illustrate taxa of interest on the sunburst,
as well as a overall representation of Life contributed by artist Susan Taylor, "The Importance of Plankton"
can be seen at the BioGaliano Web of Life.
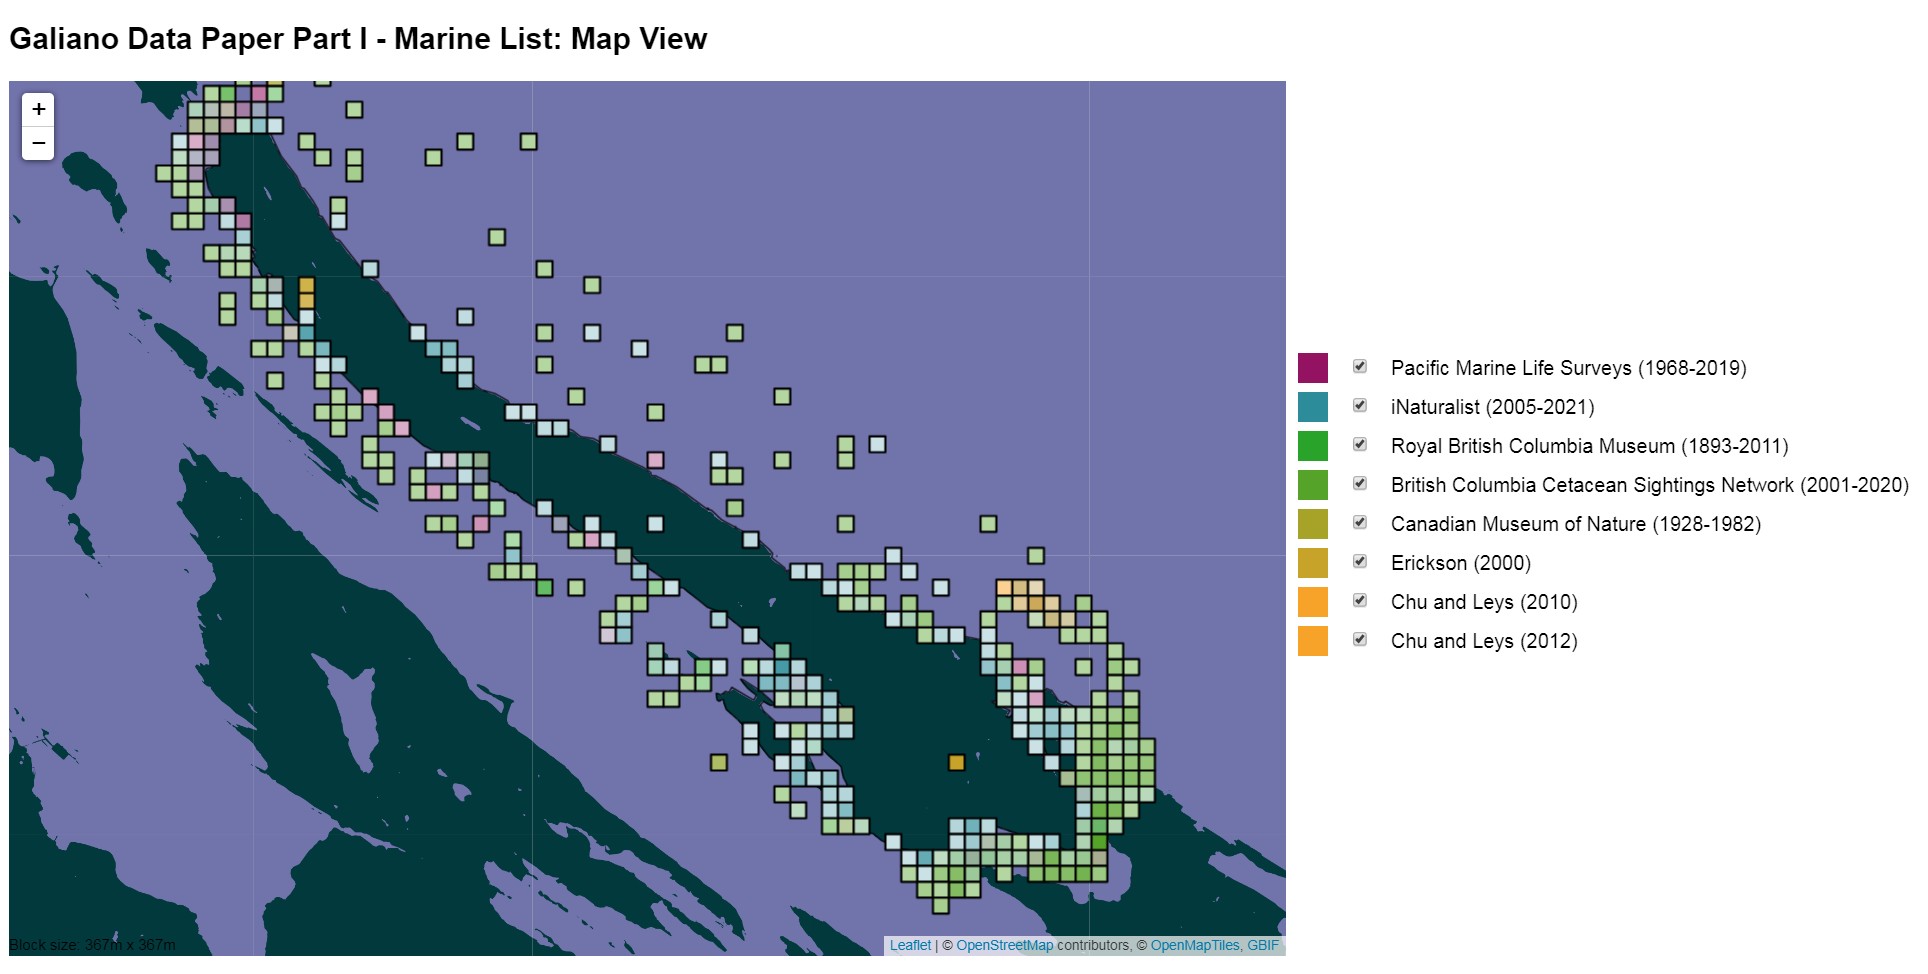
Galiano Data Paper Part I - Marine Animals
Our best-curated dataset, the result of a 2 year process of repeatedly reconciling:
- On the one hand, upstream data from numerous
sources, e.g., citizen science data from iNaturalist and
Cetacean Sightings Network; collections data from the
Royal BC Museum and Canadian Museum of Nature;
data curated by regional specialists, such as
Pacific Marine Life Surveys;
and various sources of data from the scientific literature (e.g., .Chu & Leys, 2012).
The "fusion" file specifying the weaving of the data sources in this direction can be found in GitHub at
fusion.json5 and the
final raw observation data prior to visualisation is at
reintegrated-obs.csv.
- On the other hand, species checklists curated by more than a dozen subject matter experts held as
taxon-specific spreadsheets in Google Docs.
The "fusion" file specifying the weaving of the data sources in this direction can be found in GitHub at
fusion.json5 and the
final reconciled checklist is at
reintegrated.csv.
The export files (CSV, XLSX) prepared for submission to Pensoft's Biodiversity Data Journal and the Global
Biodiversity Information Facility are at arphified.
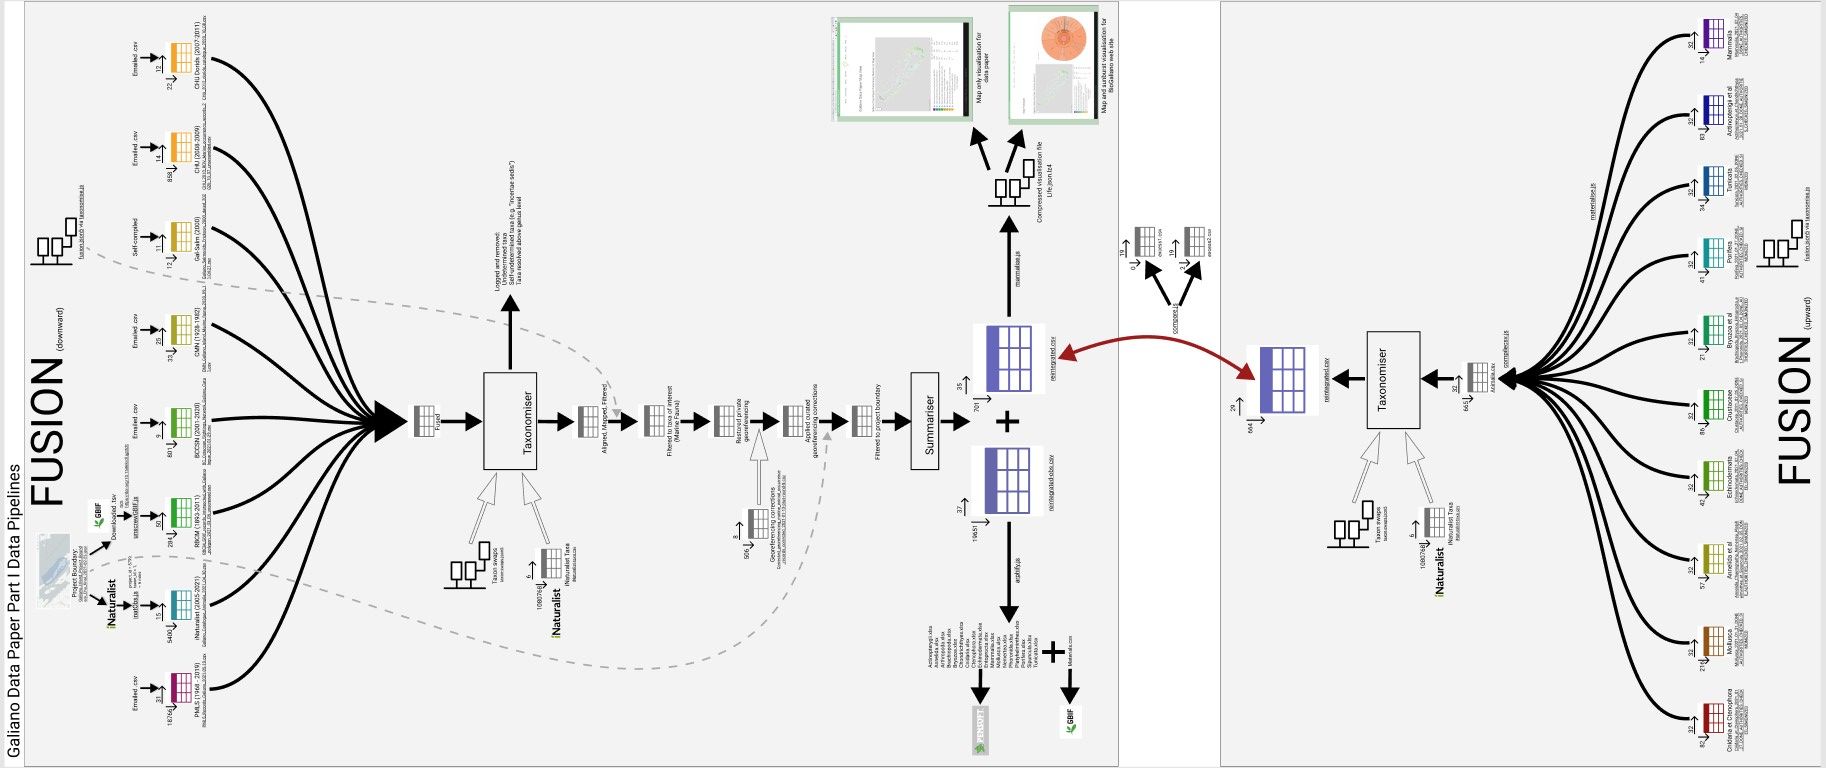
There is a Figma visualisation showing the "two-ended funnel" of this data reconciliation pipeline.
The visualisation submitted to the journal was a stripped-down map showing datasets and observation counts.
However, a full visualisation of the data is also available here showing the data in their
original form with the same panels as seen in the Life List above, together with the map view.
The data paper was published in the Biodiversity Data Journal on 2022-03-10 as
Toward an atlas of Salish Sea biodiversity: the flora and fauna of Galiano Island, British Columbia, Canada. Part I. Marine zoology.
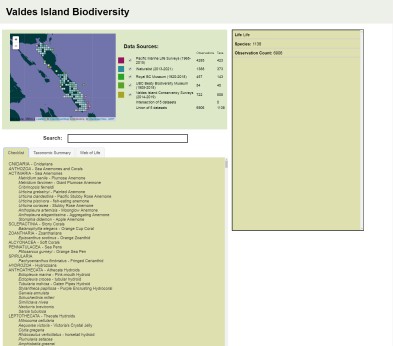
Valdes Island
A project undertaken for the Valdes Island Conservancy, the
Valdes Island Biodiversity visualisation weaves together observational data
from many sources: citizen science data from iNaturalist and the Valdes Island Conservancy;
collections data from the Royal BC Museum and the
UBC Beaty Biodiversity Museum; and data curated by regional naturalists, e.g., the
Pacific Marine Life Surveys.
This is a gridded map-based visualisation using the GBIF map tile set.
The "fusion" file specifying the weaving of the data sources can be found in GitHub at
fusion.json5 and the
final raw observation data prior to visualisation is at
reintegrated-obs.csv.
Átl’ka7tsem/Howe Sound
A preliminary visualisation of the species list
for the Átl’ka7tsem/Howe Sound UNESCO Biosphere Reserve,
compiled by Judith Holm on bealf of the Squamish Environment Society.
This visualisation compiles data from iNaturalist, the
Royal BC Museum and the
UBC Beaty Biodiversity Museum and from local naturalists, e.g.,
K. Ricker and C. Dale's bird checklist.
The "fusion" file specifying the weaving of the data sources can be found in GitHub at
fusion.json5 and the
final raw observation data prior to visualisation is at
reintegrated.csv.
Components from Ben Keen
Kindly contributed to IMERSS by Ben Keen are components for working with species checklists and
presenting observations reported to iNaturalist.
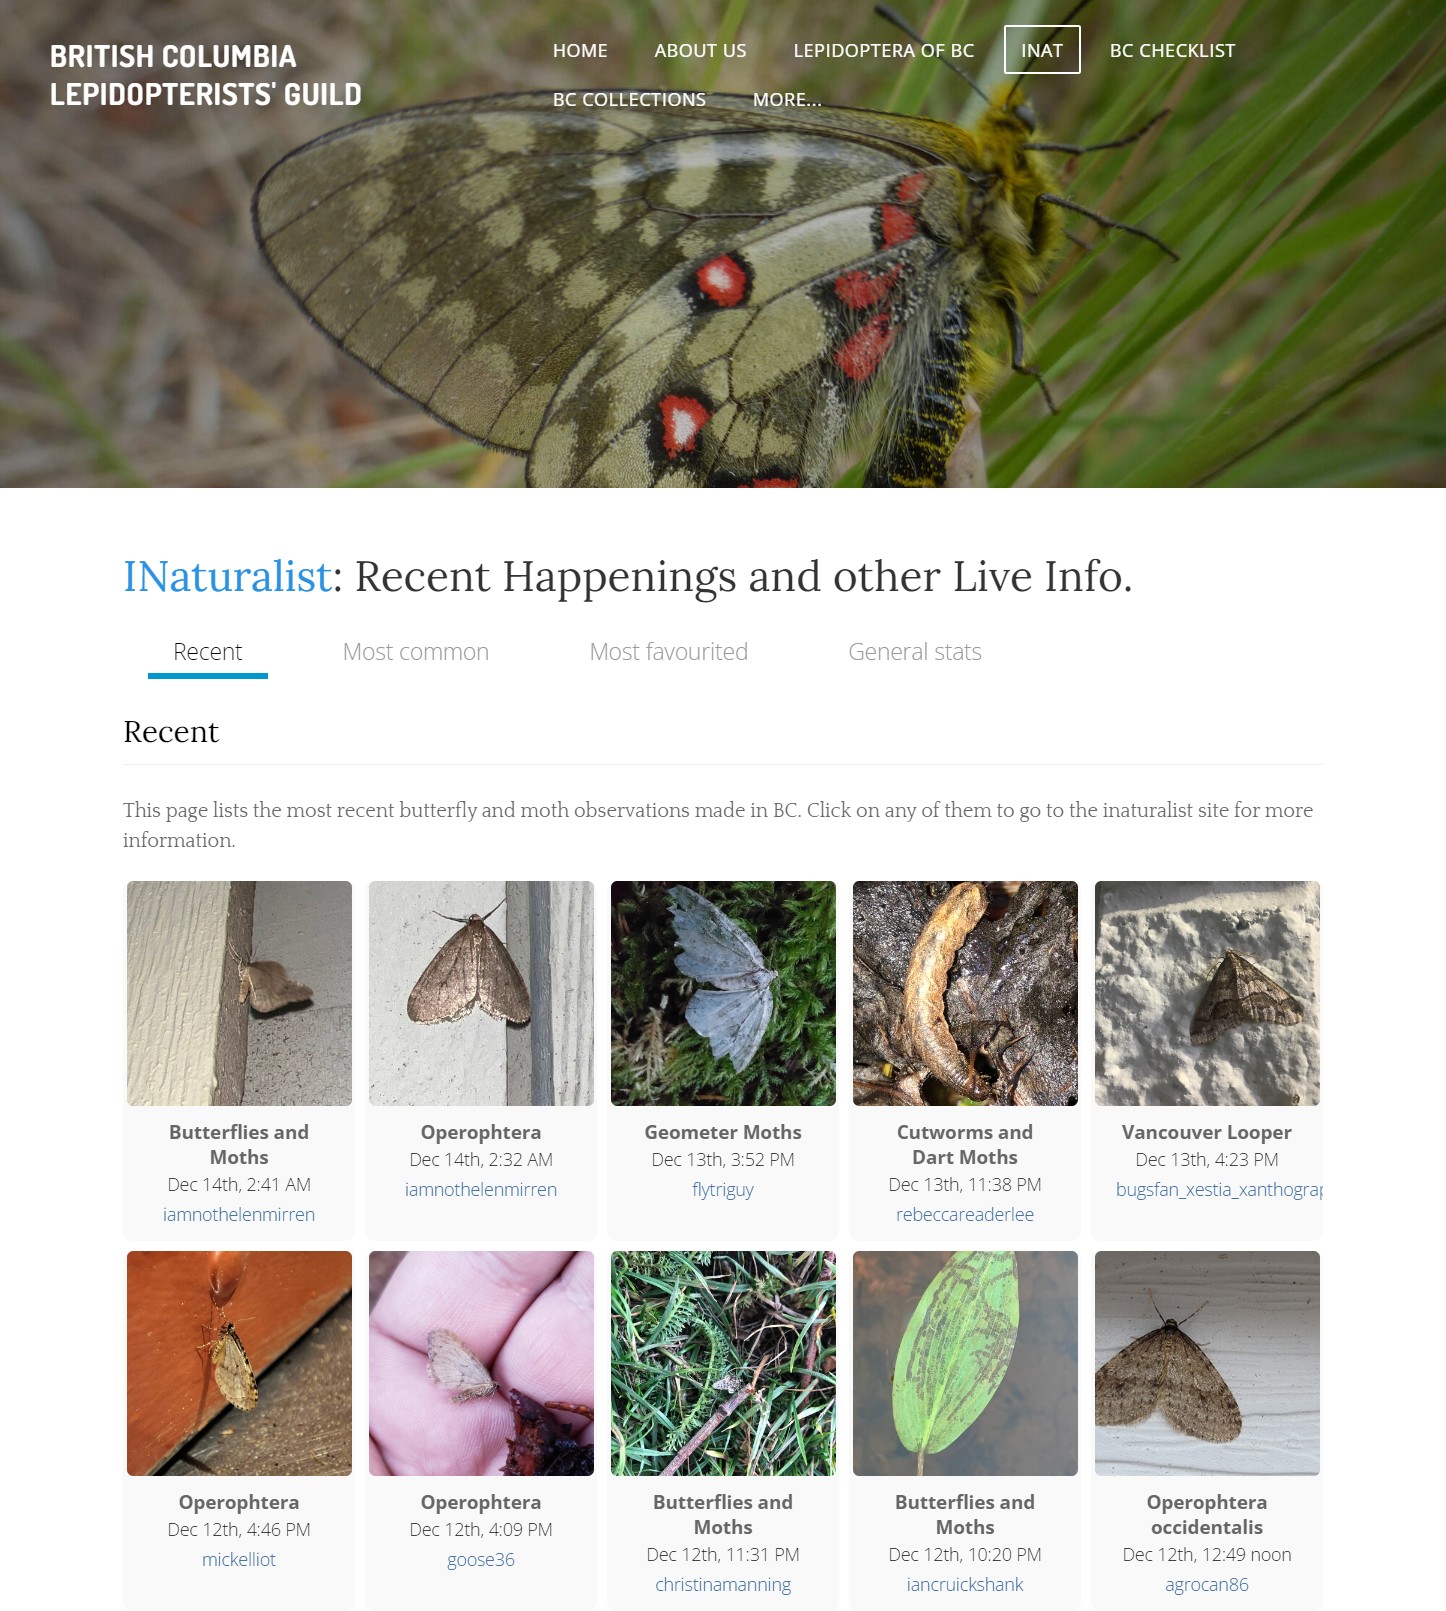
iNaturalist observations widget
Prebuilt React components to display iNaturalist data on your own sites.
The widget was originally implemented to provide
an interactive page on the BC Lepidoptera website so
visitors could see some high-level information about butterflies and moths spotted in British Columbia.
However, the code was written to allow it to be
re-used by any website, to visualise any taxon or place. Code for these components is housed in the
IMERSS inat-components repository.
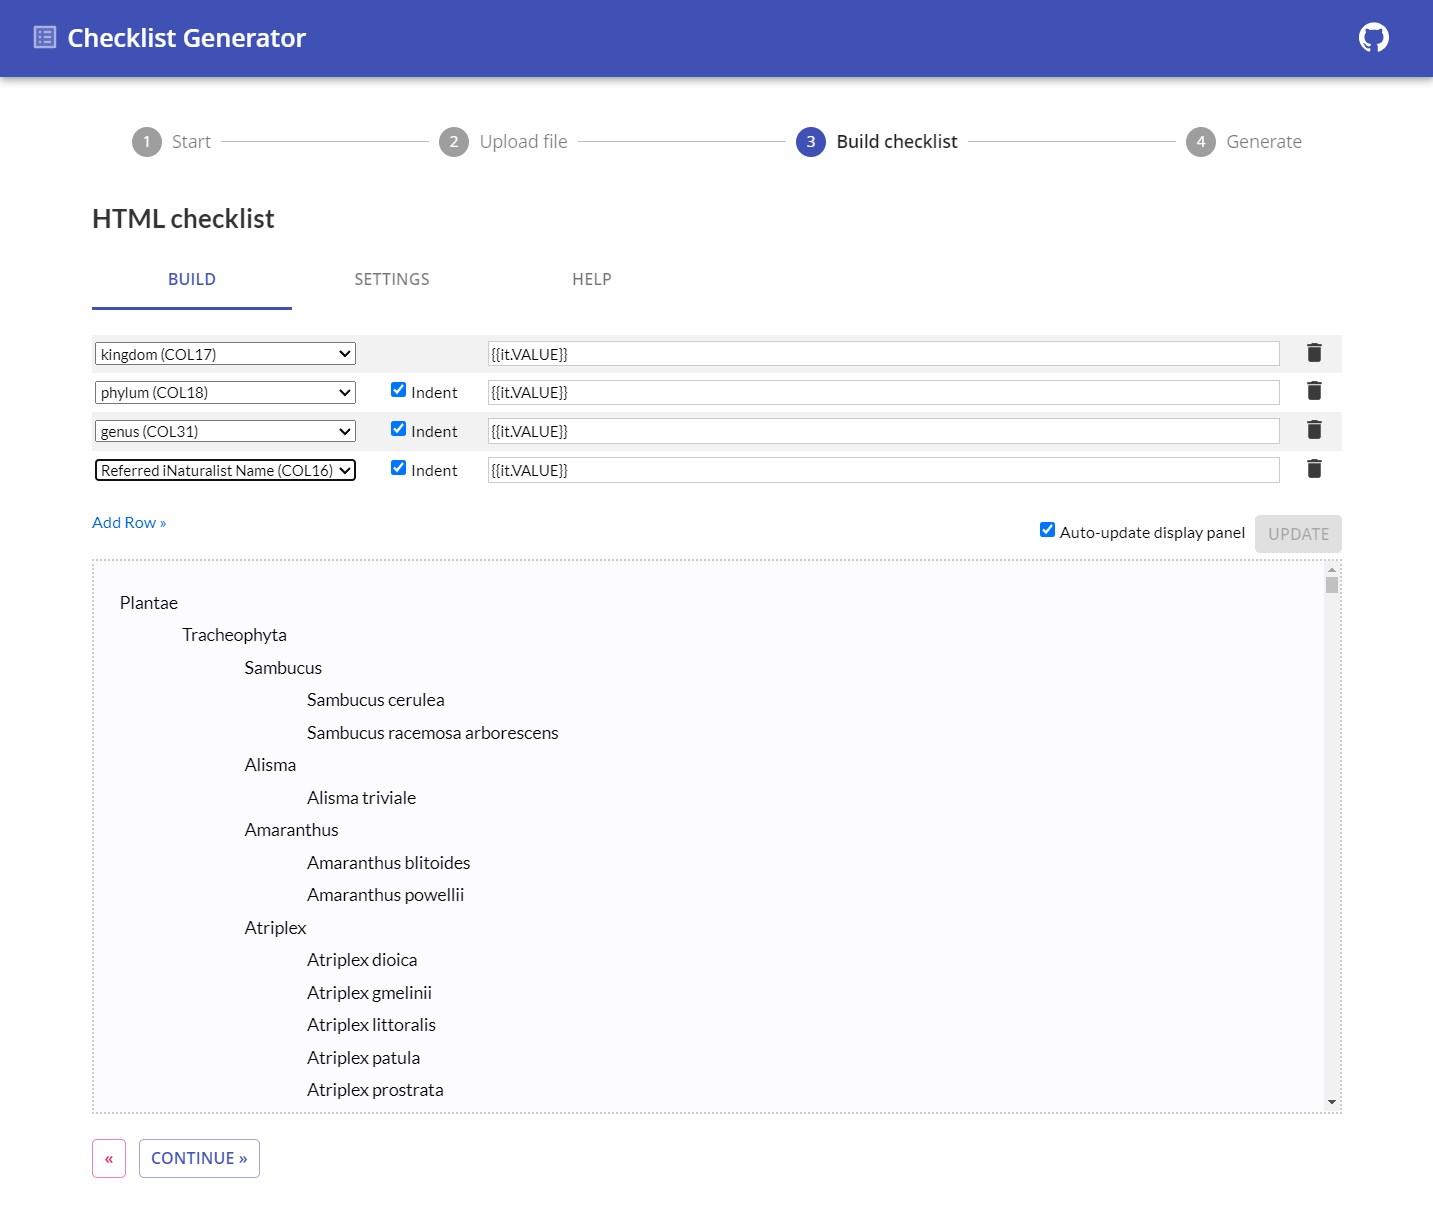
Checklist generator
A simple tool that converts a CSV file into a checklist of rows, grouped by hierarchy. See the live site
for an explanation of the functionality. Code for this component is housed in the IMERSS checklist-generator
repository.